











When I first started trading, I’d stare at charts for hours, trying to make sense of the ups and downs. It wasn’t until I stumbled onto candlestick patterns that things clicked—suddenly, the market wasn’t just random noise; it was telling a story.
These little bars of price action are like the market’s handwriting, revealing what buyers and sellers are up to. Whether you’re a newbie or a seasoned trader, mastering candlestick patterns can sharpen your edge. Let’s dive into what they are, why they matter, and the key ones you need to know to trade with confidence.
What Are Candlestick Patterns?
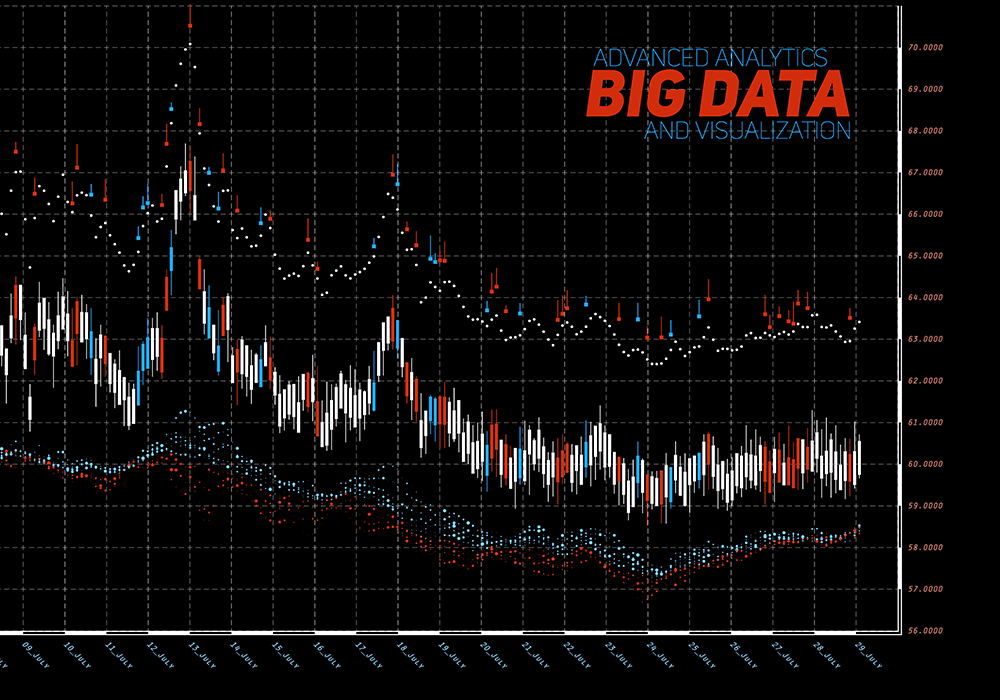
Candlesticks are the building blocks of most trading charts. Each one shows four things: the opening price, closing price, high, and low for a specific timeframe—could be a minute, an hour, a day, whatever you’re watching. The “body” is the thick part between the open and close; the “wicks” (or shadows) stretch to the high and low. Green means the price closed higher than it opened—bulls won. Red means it closed lower—bears took over.
Patterns emerge when these candlesticks line up in certain ways. They’re clues to what’s brewing: a reversal, a continuation, or just indecision. Traders have been decoding them since Japanese rice merchants started using them centuries ago, and they still work because human psychology hasn’t changed.
Why They Matter More Than You Think
Here’s the deal: candlesticks aren’t just pretty—they’re a window into market sentiment. A long green candle with no wick? Buyers were in a frenzy, pushing hard. A tiny body with long wicks? Nobody’s sure who’s winning. When you spot a pattern, you’re seeing the crowd’s mood shift, and that’s your chance to act—before the move’s obvious to everyone else.
They’re not foolproof, though. A pattern alone won’t make you rich; you’ve got to pair it with context—support levels, trends, volume, or even broader index trading opportunities that reflect macro momentum. But once you get the hang of them, they’re like a cheat code for timing your entries and exits.
The Must-Know Patterns
There are dozens of candlestick patterns out there, but you don’t need to memorize a textbook. Start with these heavy hitters—they show up often and pack a punch:
- Doji: A tiny body where the open and close are super close, often with long wicks. It screams indecision—like the market’s holding its breath. Spot it after a big run-up or drop, and it could signal a reversal.
- Hammer: A small body near the top, with a long lower wick (at least twice the body’s length). It’s a bullish sign—sellers tried to push down, but buyers fought back hard. Best when it’s at support after a downtrend.
- Shooting Star: Flip the hammer—small body near the bottom, long upper wick. It’s bearish—buyers pushed up, but sellers slammed it back down. Look for it at resistance after an uptrend.
- Engulfing Patterns: Two candles here. A bullish engulfing has a small red candle followed by a big green one that swallows it—buyers are taking charge. Bearish engulfing is the opposite: a small green candle, then a big red one. These are reversal signals with teeth, especially at key levels.
- Morning Star: A three-candle setup after a downtrend—a red candle, a tiny doji or spinning top (indecision), then a strong green candle. It’s a bullish turnaround, like dawn breaking.
Single vs. Multi-Candle Patterns
You’ll notice some patterns—like the doji or hammer—are single candles, while others, like the morning star, take a few. Single candles are quick hits—great for scalping or confirming a hunch. Multi-candle patterns tell a longer story, so they’re better for swing trades or bigger moves. I’ve caught some of my best trades waiting for a full engulfing pattern to form, but a lone hammer’s saved me plenty of times too.
Context Is King
Here’s where newbies trip up: a hammer doesn’t mean “buy now” every time. A pattern’s only as good as its surroundings. Is that doji at a major resistance level after a 20% rally? Probably not a buy signal—more like a warning. Is the engulfing pattern backed by a spike in volume? Now you’re talking.
Zoom out on your chart. Check the trend—up, down, or sideways? Mark your support and resistance. Tools like moving averages can help clarify the dominant trend and filter out market noise. A hammer in a vacuum is just a candle; a hammer at a trendline with volume is a green light. Context turns guesswork into strategy.
Using Them in Real Trades
Let’s walk through it. Say you’re watching a stock in a downtrend, hovering near a support level you’ve drawn at $50. A hammer forms—small green body, long lower wick, right on that line. Volume’s picking up too. That’s your cue: buyers are stepping in. You buy, set a stop below the wick (say, $49.50), and aim for the next resistance at $52. The pattern’s your signal; the plan’s your profit.
I’ve done this with foreign exchange too—caught a bearish engulfing on EUR/USD at a double top, shorted it, and rode the drop. It’s not magic; it’s reading the signs and acting fast.
The Pitfalls to Dodge
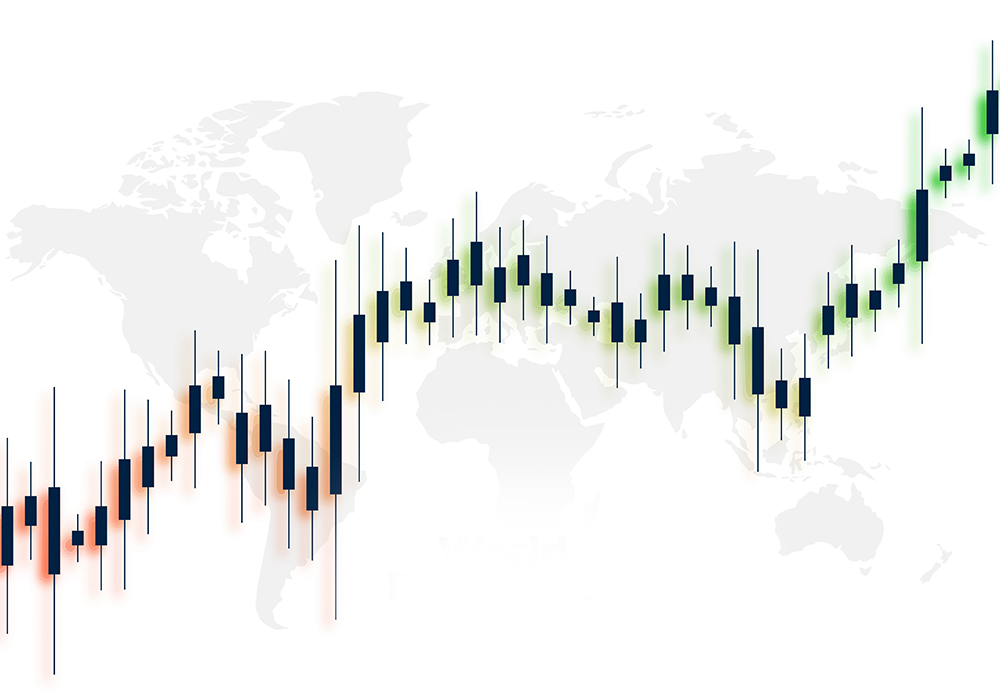
Candlesticks can trick you if you’re sloppy. A doji in a choppy range? Ignore it—too much noise. A shooting star with no trend behind it? Probably a dud. And don’t chase every pattern—overtrading’s a killer. Pick your spots, and always have a stop-loss. I learned that lesson after a “perfect” morning star flipped on me—without a stop, I’d have been toast.
Practice Makes Perfect
You won’t nail this overnight. Open a demo account or pull up old charts and hunt for patterns. Start with the big ones—doji, hammer, engulfing—and work up to the trickier stuff. Draw what you see, note what happens next. I spent weeks just sketching dojis and hammers until I could spot them in my sleep. It’s boring until it’s not—then it’s money.
Beyond the Basics: Adding Layers
Once you’re comfy, layer in other tools. Pair a hammer with an RSI below 30—oversold plus a reversal signal? That’s a double whammy. Or watch volume on an engulfing pattern—quiet volume might mean a fakeout, loud volume means business. Candlesticks are your foundation; the rest is gravy.
The Payoff: Seeing the Market’s Next Move
Candlestick patterns won’t make you psychic, but they’ll make you sharp. They’re the market whispering its secrets—if you listen, you’ll catch trades others miss. I’ve turned tiny clues, like a doji at support, into wins that kept my account growing. It’s not about being right every time; it’s about stacking the odds. So grab a chart, start spotting, and let the candles guide you.